Last updated on February 26, 2020

This post explains the use of NVivo software package for analysis of qualitative data. It focuses on four aspects:
- coding
- categorization
- relationships
- comparison of background variables
First, coding. This is simply giving names to phenomena observed in the material. It’s a process of abstraction and conceptualization, i.e. making the rich qualitative material more easily approachable by reducing its complexity into simple and descriptive codes which can be compared to and associated with one other at the later stages of the analysis.
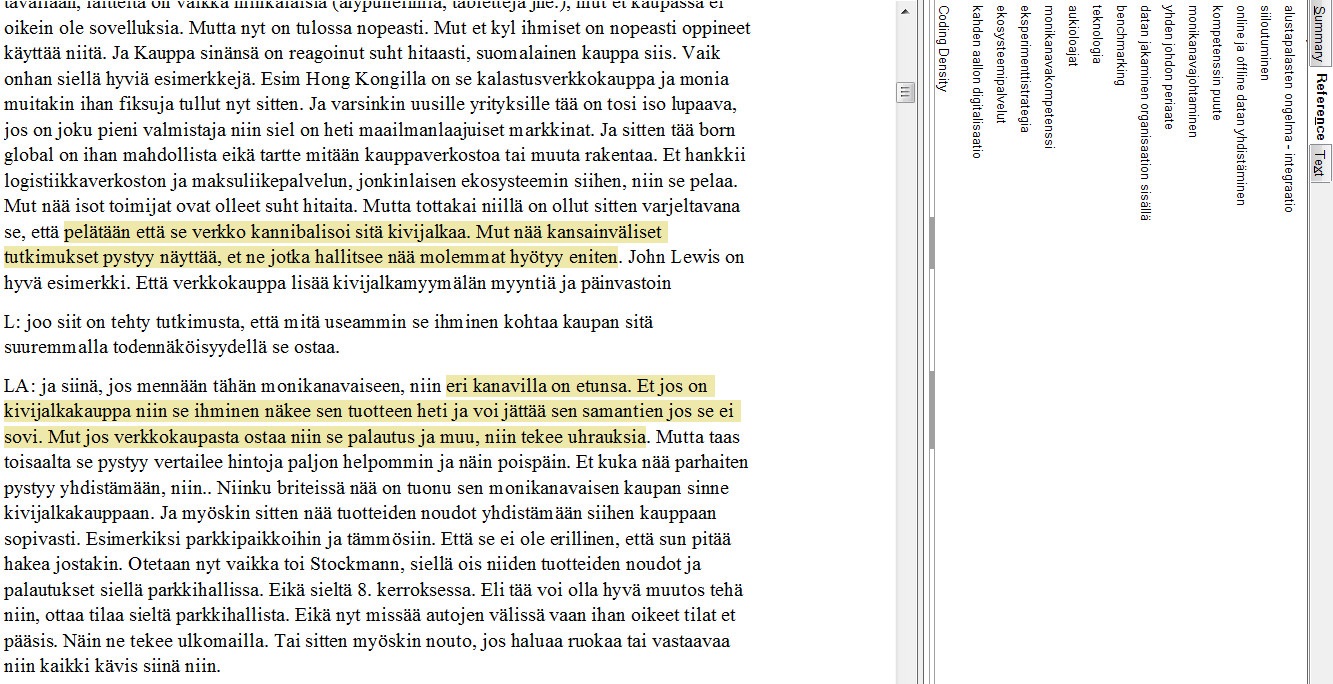
(In the picture, the highlighted areas are coded by right-clicking them and giving them a descriptive label which relates to a phenomenon of interest.)
You can think of the codes shaping up in two ways: a) from previous literature or b) emerging as important points in the material based on researcher’s judgment. (You can think of this from the perspective of deductive/inductive emphasis.) Either way, they’re associated with one’s research questions — the material always needs to be analyzed in the light of one’s research questions so that the results of the analysis remain relevant for the study’s purpose. Oftentimes, the first step of reading and coding of all material is referred to open coding (e.g., Strauss & Corbin, 2008).
Second, categorization. This is simply bundling the codes with one another and placing them in a hierarchical “structure”.
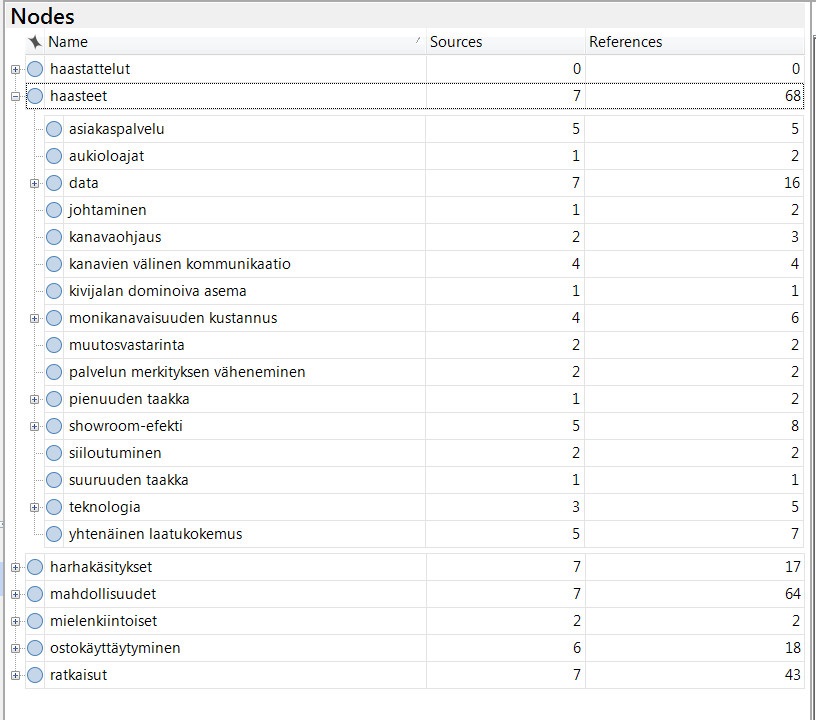
(In the picture, you can see codes being formulated as “main themes” and “sub-themes”, i.e. categories that contain other categories.)
The structure should follow the operationalization of the study — this usually comes naturally because the material is closely linked to interview questions which then again are linked to research questions (which are linked to the purpose of the study to form a full circle from analysis to study purpose). For example, in the above picture the categories, or themes, relate to challenges and opportunities of multichannel commerce – the topic under scrutiny.
Third, relationships. This is important – while reading the material, the researcher should form tentative relationships in his or her head. For example, “I see, x seems to be associated with y“. These are the “heureka” moments one gets while immersed in the analysis.
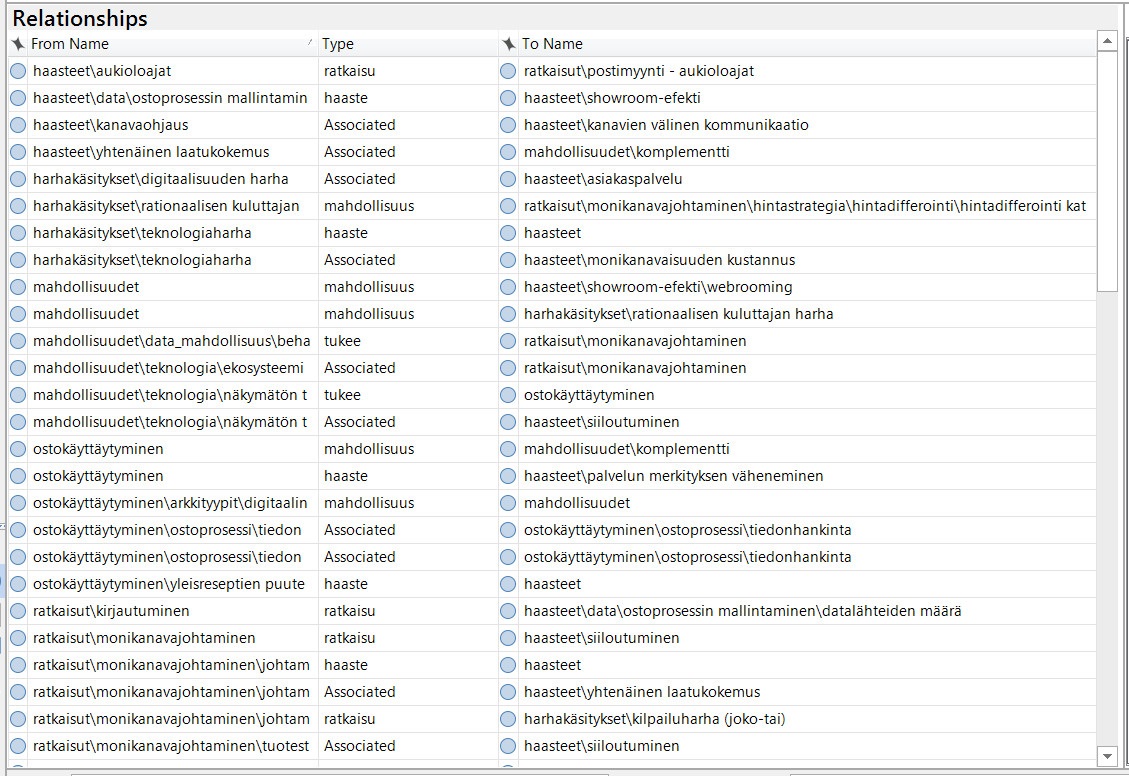
(In the picture, you can see several tentative relationships emerging from the analysis. A portion of them will be chosen for further validation/falsification, and potentially reported as outcomes of the study.)
The relationships can be coded instantly as you come across them — the beauty of NVivo is that you can code evidence (direct citations) into the relationships, and then later when you click the relationship open, you can find all associated evidence (the same applies for all codes and categories). So, as you analyze the material further you can add confirming and contrary evidence to the previously thought of relationships while a keeping a “trail of thought” useful for reporting of the results. It is important to understand that at this point of the analysis the discovered relationships are so-called interim findings rather than final conclusions.
Now, qualitative research can result in several outcomes in terms of reporting, one being propositions. Propositions are conclusions of qualitative analysis; they are in a way tentative suggestions of general relationships, and can be formulated into hypothesis for quantitative testing. However, the propositions can be “validated” or turned more robust by qualitative comparison as well. This is done through an iterative process of a) reading the material repeatedly and trying to find both confirmatory and falsifying evidence for the interim propositions, and 2) collecting more research data especially focused on learning more about the tentative propositions (in Grounded Theory, this is referred to as theoretical sampling, see Glaser and Strauss, 1967). When you have done the process of comparative analysis and theoretical sampling, you can have more confidence (not in statistical but analytical sense) in your propositions.
Fourth, comparison of background variables. It took me a long time to learn the power of comparing background information – but the potential and importance is really high, especially when the qualitative analyst wants to move beyond description to deeper understanding. I believe it was Milton Friedman who said the goal of research should be to find “hidden constructs” of reality. In quantitative studies this is done by a) identifying latent variables and 2) finding statistical relationship between variables. In qualitative studies, we do not speak of relationships in statistical sense but rather of “associations” which can be of many types (some examples below).
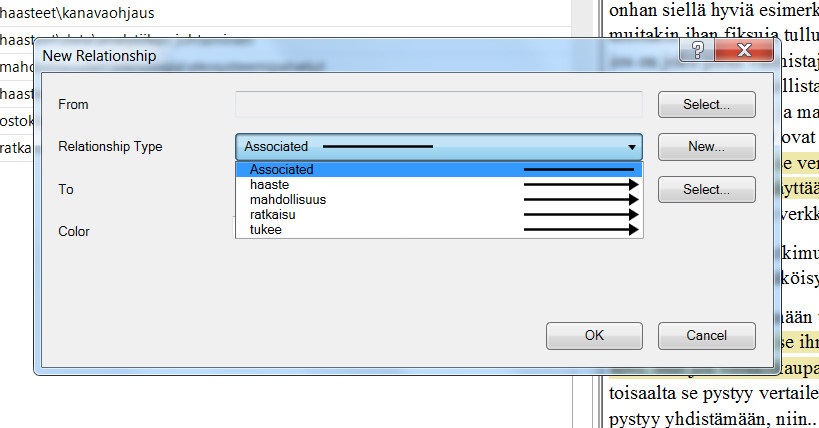
(The picture depicts different types of associations named by the researcher, including i.a. “challenge”, “solution”, “opportunity”)
Anyway, there is absolutely no reason why we should not pursue discovery of hidden realities also in qualitative studies. In NVivo, this can be done via classifications and attributes. First, decide which are the important background information you want to compare. Then, include that in your interview questions. Once you have the material, code all interviews (each representing an informant) as nodes – to these nodes, you will assign a classification schema with the chosen background information (attributes).
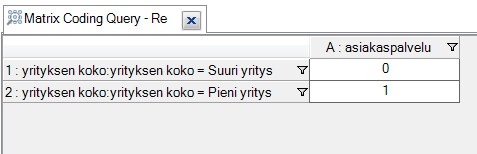
(The picture includes a comparison matrix of small and large firm representatives views on customer service challenges — it can easily be expanded to include other dimensions as per the analysis framework.)
For example, consider you would like to compare the views of small and large firms on a specific multi-channel challenge, say customer service. You create a classification schema and give it the attribute of “size” with two potential values, small and large. Then, you’d run a matrix code query including small and large as rows and customer service as a column. Here, you can see the number of occurrences and more importantly, you can click them “open” to see all the associated evidence. You’re still tied to researcher’s judgment or “interpretativism” when comparing the answers, but at least this way you can conduct comparisons more systematically and in accordance with your analytical framework. It also helps you to discover patterns – for example, we could find that large firms tend to emphasize different challenges than smaller firms.
Finally, I’d say the fifth important aspect of qualitative analysis is visualization of the results, usually in the form of a model or framework. Unfortunately this is where NVivo fails hard.
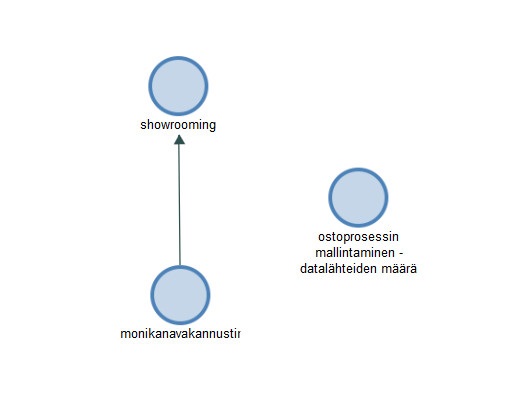
(Unfortunately, it is important to draw a moderating line from the third variable to the relationship of the two other variables in NVivo. Use PowerPoint instead!)
For example, you can’t draw “moderating” relationships, and also the variable names are cut short in language such as Finnish which has long words (I’ve reported these shortcomings to QSR which is the maker of NVivo). Granted, moderation is usually understood as a property of quantitative studies, but there’s no reason why a qualitative framework or model shouldn’t also incorporate them in a conceptual model (which could be later tested by structural equation modeling, for example). So, until these problems are fixed, I’d recommend sticking to other tools for visualization, such as Microsoft PowerPoint.
References:
- Corbin, J., & Strauss, A. (2008). Basics of Qualitative Research: Techniques and Procedures for Developing Grounded Theory. SAGE.
- Glaser, B. G., & Strauss, A. L. (1967). The Discovery of Grounded Theory: Strategies for Qualitative Research. Transaction Publishers.
About Joni:
The author holds a PhD in marketing, and is teaching and conducting research at the Turku School of Economics. His topics of interest include digital marketing, startup companies and platforms.